
Filter by
SubjectRequired
LanguageRequired
The language used throughout the course, in both instruction and assessments.
Learning ProductRequired
LevelRequired
DurationRequired
SkillsRequired
SubtitlesRequired
EducatorRequired
Results for "dygraphs"
Coursera Project Network
Skills you'll gain: Data Storytelling, Plotly, Data Presentation, Matplotlib, Interactive Data Visualization, Seaborn, Data Visualization, Data Visualization Software, Statistical Visualization, Scatter Plots
Coursera Project Network
Skills you'll gain: Pandas (Python Package), NumPy, Data Analysis, Data Science, Python Programming, Data Structures, Data Manipulation, Computer Programming
 Status: Free
Northeastern University
Skills you'll gain: Data Storytelling, Statistical Visualization, Data-Driven Decision-Making, Data Visualization Software, Data Mining, Visualization (Computer Graphics), Exploratory Data Analysis, Data Cleansing, Data Analysis, Data Manipulation, Big Data, Programming Principles, Python Programming

University of California San Diego
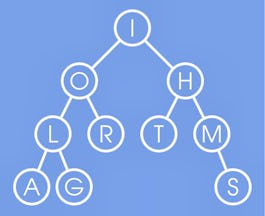
Skills you'll gain: Graph Theory, Combinatorics, Network Analysis, Data Structures, Network Routing, Algorithms, Theoretical Computer Science, Operations Research
University of California San Diego
Skills you'll gain: Graph Theory, Algorithms, Network Routing, Programming Principles, Data Structures, Network Analysis, Network Model, Computer Programming
In summary, here are 5 of our most popular dygraphs courses
- Data Visualization & Storytelling in Python: Coursera Project Network
- Python for Data Analysis: Pandas & NumPy: Coursera Project Network
- Data Visualization with Python & R for Engineers: Northeastern University
- Introduction to Graph Theory: University of California San Diego
- Algorithms on Graphs: University of California San Diego


