
Filter by
SubjectRequired
LanguageRequired
The language used throughout the course, in both instruction and assessments.
Learning ProductRequired
LevelRequired
DurationRequired
SkillsRequired
SubtitlesRequired
EducatorRequired
Results for "dygraphs"
Skills you'll gain: Data Visualization Software, Plotly, Data Visualization, Dashboard, Interactive Data Visualization, Matplotlib, Seaborn, Data Analysis, Geospatial Information and Technology, Pandas (Python Package), Scatter Plots, Histogram, Heat Maps, Box Plots
University of Michigan
Skills you'll gain: Matplotlib, Plot (Graphics), Data Visualization Software, Interactive Data Visualization, Scientific Visualization, Visualization (Computer Graphics), Statistical Visualization, Graphing, Scatter Plots, Data Manipulation, Histogram, NumPy, Pandas (Python Package)
 Status: Free
DeepLearning.AI
Skills you'll gain: Query Languages, Data Storage, Semantic Web, Unstructured Data, Generative AI, Graph Theory, Text Mining, Information Architecture
 Status: Free
DeepLearning.AI
Skills you'll gain: ChatGPT, OpenAI, Generative AI, Artificial Intelligence, Human Machine Interfaces
Coursera Project Network
Skills you'll gain: Exploratory Data Analysis, Seaborn, Plotly, Data Visualization Software, Interactive Data Visualization, Data Analysis, Python Programming, Scatter Plots, Statistical Analysis, Predictive Modeling, Box Plots, Histogram, Jupyter, Cloud Applications
Coursera Project Network
Skills you'll gain: Data Import/Export, Technical Communication, Technical Documentation, Graphical Tools, User Accounts

Coursera Project Network
Skills you'll gain: Image Analysis, Software Installation, Data Analysis, Data Visualization Software, Scientific Visualization, Histogram, User Interface (UI), UI Components
Coursera Project Network
Skills you'll gain: Plotly, Interactive Data Visualization, Data Visualization Software, Scatter Plots, Ggplot2, Exploratory Data Analysis
 Status: Free
California Institute of the Arts
Skills you'll gain: Typography, Infographics, Graphic and Visual Design, Computer Graphics, Visual Design, Design, Graphic Design, Graphic and Visual Design Software, Design Elements And Principles, Computer Graphic Techniques, Digital Design, Color Theory, Adobe Photoshop, Adobe Creative Cloud, Creativity

Johns Hopkins University
Skills you'll gain: Exploratory Data Analysis, Data Visualization, Ggplot2, Dimensionality Reduction, Data Visualization Software, R Programming, Graphing, Data Storytelling, Data Analysis, Statistical Analysis, Unsupervised Learning, Statistical Methods
Coursera Project Network
Skills you'll gain: PyTorch (Machine Learning Library), Image Analysis, Deep Learning, Artificial Neural Networks, Machine Learning Methods, Computer Vision
Coursera Project Network
Skills you'll gain: Generative AI, PyTorch (Machine Learning Library), Deep Learning, Artificial Neural Networks, Computer Vision, Applied Machine Learning
In summary, here are 10 of our most popular dygraphs courses
- Data Visualization with Python: IBM
- Applied Plotting, Charting & Data Representation in Python: University of Michigan
- Knowledge Graphs for RAG: DeepLearning.AI
- AI Agents in LangGraph: DeepLearning.AI
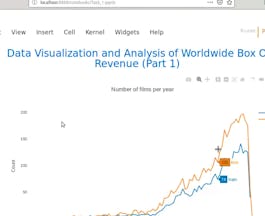
- Analyze Box Office Data with Seaborn and Python: Coursera Project Network
- Create IT Diagrams with Lucidchart: Coursera Project Network
- Getting started with ImageJ: Coursera Project Network
- Data Visualization with Plotly Express: Coursera Project Network
- Fondamentaux de l’infographie: California Institute of the Arts
- Exploratory Data Analysis: Johns Hopkins University


